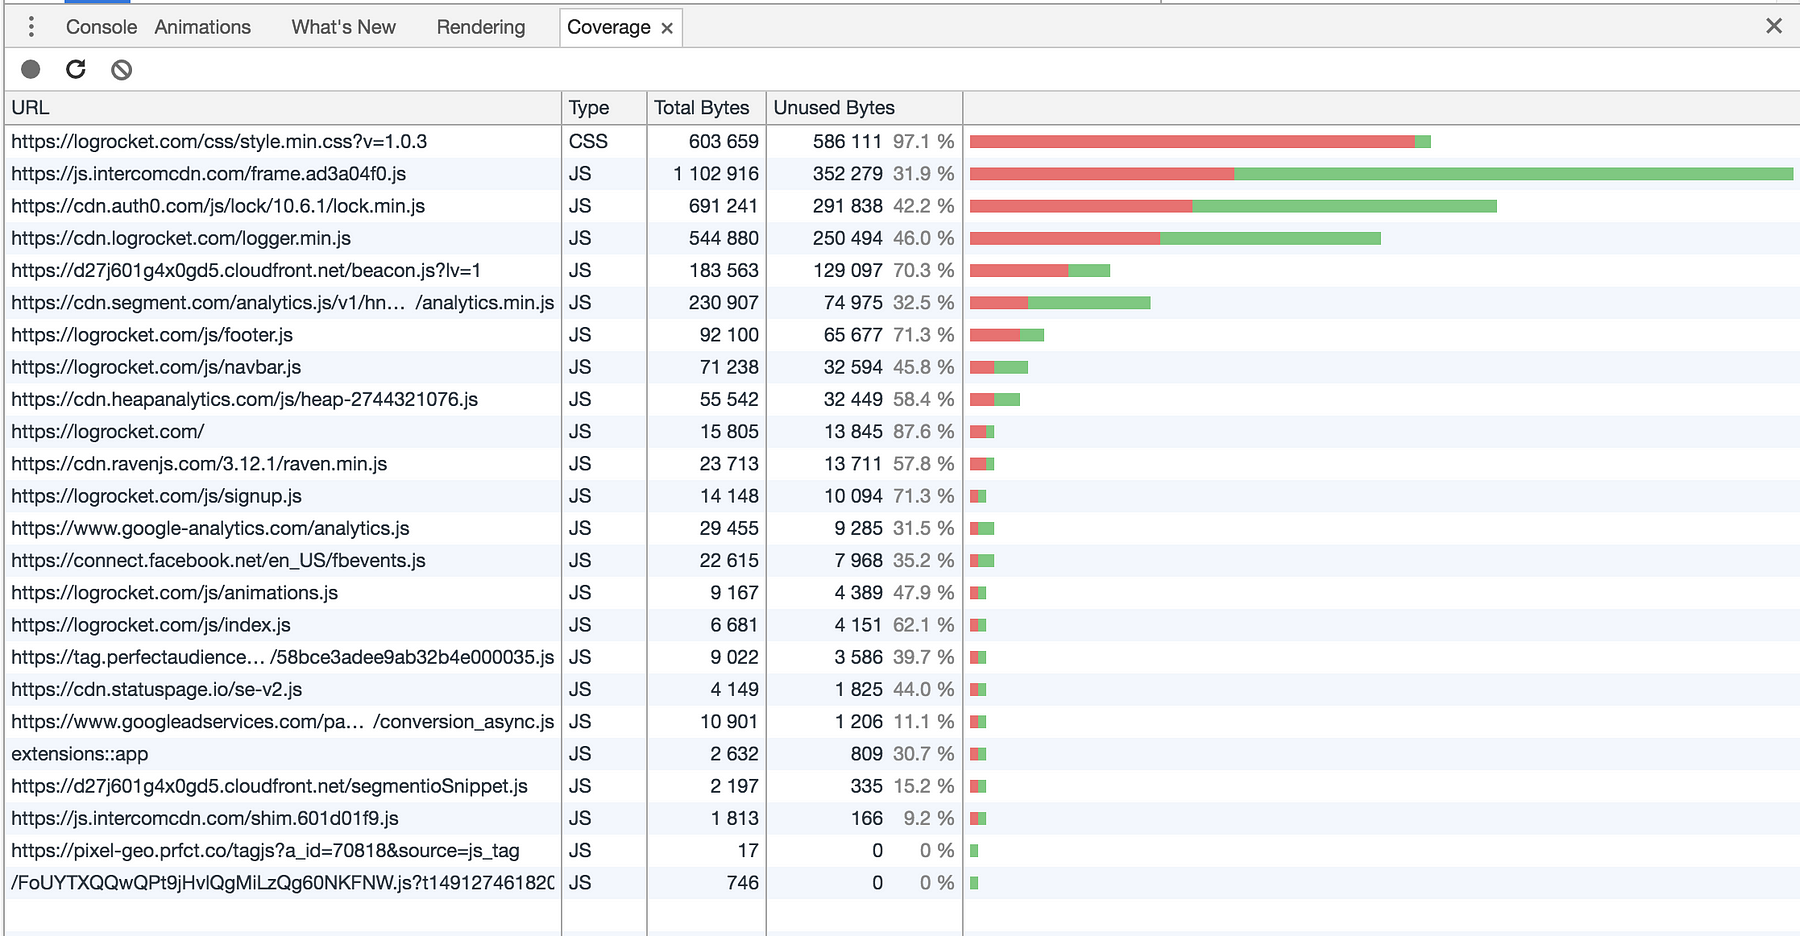
Coverage
Use Coverage to analyze how much code in the CSS, JS files was actually used on the page.
It is updated in real time
Go to Dev tools > Sources > Coverage
Rendering FPS

Mobile testing
### Put your Android in development mode
Go to Settings / About Phone / tap Build number 7 times
Enable USB Debugging
Settings / Developer options / turn on USB Debugging
Install Chrome Beta
Open Chrome Beta and Allow USB debugging

Time for JS execution
- Open Performance and record
- Go to Sources pannel and execution time will be displayed on the left side.
Compare performance data
Go to Performance tab, record performance and save it.
Later you can view historical performances.